Visual Thinking for Design
- Author
- Colin Ware
Explains how human visual perception works and how to apply it to design (visual design, data visualization, etc.). Its content is almost identical to the same author’s Information Visualization: Perception for Design; that book is closer to a textbook for specialists, while this one is closer to a condensed version for practitioners. (Incidentally, Colin Ware’s work is cited extensively in almost every recent visualization book, and Stephen Few, author of Now You See It and other books, recommends C. Ware’s books as the most important reading.) Summarized around 2014.
Preface
Introduces “active vision,” emphasizing that seeing is a highly active process rather than passive processing of light entering the eyes. We move our bodies, heads, and eyes (ambulatory vision) and choose, consciously or unconsciously, which incoming signals to prioritize.
The book asks how this “active vision” perspective can inform design.
Embodied cognition offers deeper discussions of the active nature of perception and the externalization of perception and consciousness. See these summaries:
Chapter 1. Visual Query
Perhaps the most important term in the active-vision perspective is visual query: an active, dynamic process of extracting desired information from the world before our eyes by using eye movements and the brain’s pattern-finding circuits.
Designing to support smooth visual querying requires understanding how vision works. The rest of chapter 1 explains it from bottom-up and top-down perspectives. In brief:
- The fovea lies at the center of the retina and has the highest resolution.
- Both bottom-up and top-down processes matter in perception.
- Bottom-up processing finds features in the retinal image, combines them into patterns, and combines those into objects.
- Top-down processing uses attention to regulate which objects, patterns, and features receive more intensive processing.
For details, see Visual query and data visualization.
Chapter 2. What We Can Easily See
This chapter mainly discusses the pop-out effect: particular information seems to “jump out” of a display. For example, a few dark red dots among pale gray dots on a white background stand out clearly.
Pop-out effects can be created with visual features processed mainly in the primary visual cortex (V1, also called PVC), such as distinctive colors, orientations, sizes, shadows, and focus. “Mainly V1” is the qualification because some features, such as motion, can also produce pop-out effects even though they are not thought to be fully processed in V1.
Here is an example. The circles and red Xs appear to pop out.
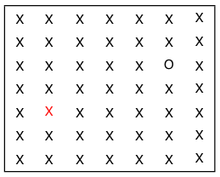
One particularly useful concept is feature space. Imagine a multidimensional space with a dimension for each visual feature (orientation, size, color, shadow, focus, motion, etc.). Any visual representation can be regarded as occupying a point in this space. We can then think about how much to make a representation stand out as “how far to place it from the other representations in feature space.” Used well, this idea could help systematize or quantify various design decisions.
For details, see Effective use of visual features.
Chapter 3. Structuring Two-Dimensional Space
The world is three-dimensional, but the information entering our eyes is two-dimensional (2.5D, according to David Marr). This chapter examines how vision extracts (constructs) information about three-dimensional space—patterns, objects, and so on—from two-dimensional information, and how to use this in design.
The first part explains how features detected in V1 are bound together and used to separate foreground from background or one object from another. In short, generalized contours are constructed from differences in texture and motion, continuous changes in orientation, and so forth.
From these principles, the author derives the concept of natural mapping between visual representations and meaning: tendencies to assign meaning to visual patterns shared across cultures, independent of cultural influence or learning. For example, mapping larger numbers to larger areas, or to colors with stronger contrast against the background, is a natural tendency. (I recall Donald Norman explaining something similar in The Design of Everyday Things; look it up and connect it. Classroom light switches? AnswerMe —ak)
Chapter 4. Color
This chapter concerns color perception, focusing on the three types of cone cells sensitive to long, medium, and short wavelengths in bright light, rather than rod cells that work in dim light. The reason is that rods play almost no role in modern urban environments, particularly in visualization contexts.
The first part explains how the three kinds of cones produce three color-opponent channels and how cones are distributed around the center of the retina (fovea). From this it derives perceptual characteristics: colors that are easy to distinguish and remember, why the luminance channel is advantageous for detailed information, and luminance versus color contrast.
The latter part discusses implications for design. For example, use red, green, yellow, blue, pink, brown, orange, gray, and purple in that order for color coding (of course, when using red and green, take red–green color blindness into account and combine color with additional visual features); use relatively high saturation for small areas and low saturation for large areas; emphasize things with colors that contrast more strongly with the background (many PowerPoint presentations are hard to read because they ignore this); and when showing terrain elevation on maps or activation levels in fMRI, use luminance differences as well as hue.
For details, see Colors in data visualization.
Chapter 5. Getting the Information: Visual Space and Time
Chapter 5 covers motion and depth perception. The first part examines the depth cues human vision uses to construct three-dimensional space from 2.5-dimensional information, and explains how to apply them to design (“2.5D design”).
Here is an example of 2.5D design.
(TODO: Add an image.)
The image above, for instance, is a typical example of 2.5D design, often used in promotional materials or diagrams of complex concepts. Some characteristics: 1) the main three-dimensional images are shown from typical viewpoints that make them easy to identify; 2) they rarely overlap, and when they do, objects remain identifiable; 3) text is presented normally for easy reading, without obeying perspective or viewpoint; and 4) almost every element is scaled to a visually pleasing size regardless of relative real-world sizes (houses, factories, and cars might all be the same size). “Reproducing reality faithfully” is evidently not important in 2.5D design.
The latter part introduces cognitive costs related to movement. I think this is important for systematizing or quantifying the design process and evaluation of its results. For example, an internal pattern comparison takes about 0.04 seconds; moving the eyes from one point to another, 0.1 seconds; moving the mouse to a target, 1.0 seconds; and moving the mouse to a target and clicking, 1.5 seconds. This resembles methods used in HCI to quantify user interface efficiency.
Chapter 6. Visual Objects, Words, and Meaning
Chapter 6 covers recognition of objects and scenes and the combination of visual and nonvisual information. Nonvisual information here primarily means verbal information. I will briefly summarize object and scene recognition.
For object recognition, it introduces geon theory, which holds that the brain understands complex objects as combinations of a few simple shapes called geons. The author says this is the most controversial theory introduced in the book.
(Although he does not specifically mention it, the two-streams hypothesis and the hypothesis that the brain creates mental representations are similarly controversial.)
For scene recognition, it introduces gist perception: quickly identifying what kind of space is before us (an open area, city, forest, kitchen, etc.) and interpreting other objects accordingly. In an interesting experiment described in the book, a blurry black object was superimposed on blurry images of a road and a dining table. People tended to perceive it as a car on the road and as a water bottle on the table.
Chapter 7. Visual and Verbal Narrative
This chapter compares visual thinking with language-based thinking. Interestingly, it uses examples such as sign language to explore what “visual” means. Sign language can certainly be called visual because hand movements are read through visual processing, yet it is “verbal” in the author’s sense.
The book does not precisely define “visual” (reading written instructions requires vision too, but is not called visual in this sense). Unexpectedly, I found a definition in another book that probably fits the author’s intention.
In another study group, we are studying embodied cognition. Out of Our Heads holds that sensory modes such as vision, hearing, and touch should be distinguished by their characteristic styles. Vision’s style, for example, can be described as things getting larger when approached, smaller when moving away, disappearing when one turns around, appearing as 2.5-dimensional information, and so on. On this definition, if a patch connected to a camera is attached to a blind person’s body (the tongue, say), delivering the camera’s information as tactile signals, those sensations should actually count as vision rather than touch.
The comparison of the strengths and weaknesses of visual and verbal thinking, distinguished in this way, was particularly interesting. Concepts well suited to visual expression include:
- A is inside B.
- A passes through B.
- A is above B.
- A is connected to B.
Concepts well suited to verbal expression include:
- If… then…
- And…
- Perhaps…
It should often be possible to transform a problem so that one kind of concept (“if A, then B,” for instance) becomes another (“A is inside B”). Perhaps suitable transformations could therefore express visually even concepts usually considered better suited to language. Thinking deeply about this might lead to applications such as better visual programming languages.
Finally, the chapter introduces visual narrative and some techniques from comics and film. Even a single infographic should contain a story, so I think we have much to learn from storytelling, writing, and filmmaking.
Chapter 8. Creative Meta-seeing
Chapter 8 focuses on visualization as a thinking tool rather than a finished product: for example, the effects of sketching on designers’ or inventors’ cognitive processes.
The author lists four advantages of sketching as a thinking tool:
- A single line can have multiple interpretations (a circle might be a hole, a coin, or a covered hole such as a manhole cover).
- Sketches can be made and discarded very quickly (very cheap prototypes).
- (Similar to 1) The same sketch can be interpreted in multiple ways.
- It is easy to mentally try various transformations based on a sketch on paper or screen.
Chapter 9. The Dance of Meaning
The final chapter summarizes the preceding content and introduces the author’s own work visualizing major whale behaviors in the deep sea.
At the end, it briefly introduces John Anderson’s ACT-R. According to J. Anderson, ACT-R is a comprehensive cognitive architecture and its implementation (in LISP), bringing together findings from various areas of cognitive science about how the human brain works. Perhaps ACT-R could enable quantitative evaluation of particular visualizations, at least in part. HCI already reportedly has extensive research using ACT-R to build cognitive models and compare their predictions with actual behavior.