Visual Queries and Data Visualization
- Published
Some thoughts on improving data visualization from the perspective of visual queries.
Visual queries
Suppose we have sales data for several products. If we place the products along the X-axis and draw a bar chart with sales on the Y-axis…
How many times greater is the contribution of the product with the highest sales than that of the product with the lowest sales?
…can be turned into this visual query:
How many times longer is the longest bar than the shortest bar?
Or consider this example from Visual thinking for design:
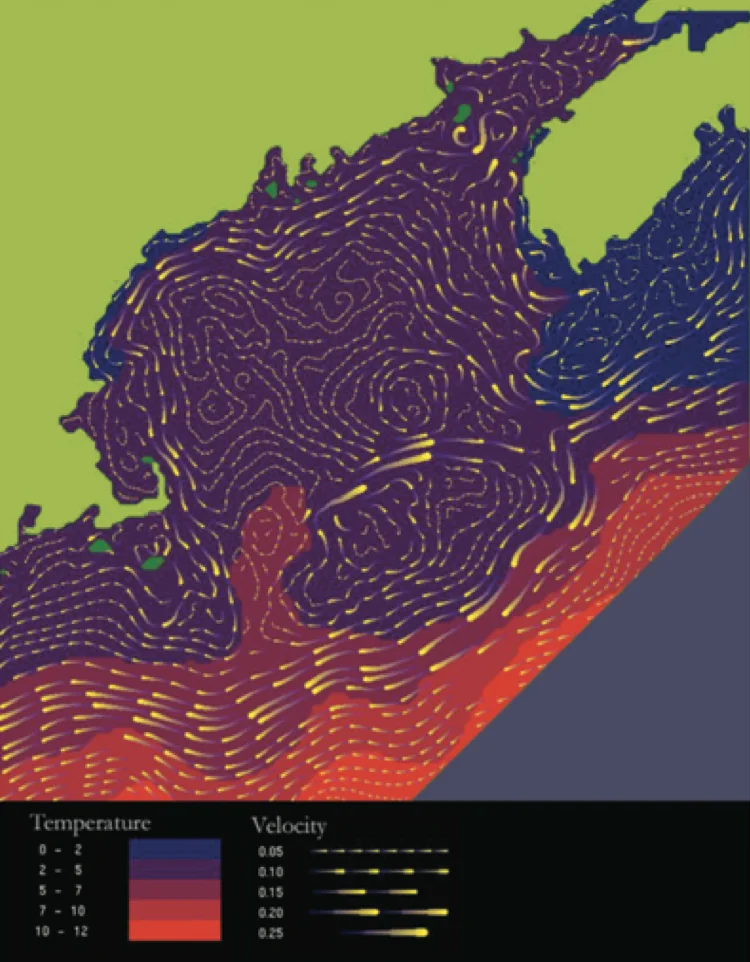
(Source: Visual thinking for design by Colin Ware)
If seawater temperature is represented by color (blue for lower temperatures) and current velocity by tadpole-like shapes (thicker and longer for faster currents), the question “Where is the current fastest?” becomes the visual query “Where is the thickest, longest tadpole?”
The quality of the design or visualization can make a major difference to the efficiency of visual queries.
Data, visual materials, and mapping
Enabling visual queries on data means mapping data to visual materials well.
Visual materials include:
- Shape
- Size
- Color
- Movement
- Position
- Texture
- And so on
Mapping means, for example:
- Representing greater sales with longer bars and lower sales with shorter bars. (Mapping sales to bar size.)
- Placing closely related data nearby and weakly related data farther apart. (Mapping relatedness to position.)
- And so on
Good mappings support efficient, accurate visual queries
There are good mappings and bad mappings. We should not map data arbitrarily to just any material. A good mapping supports efficient and accurate visual queries.
Return to the bar chart above, with each product on the X-axis and sales on the Y-axis.
How many times longer is the longest bar than the shortest bar?
How should we draw the chart so this visual query can be processed efficiently and accurately? If the bars are too far apart, the query becomes less efficient. If the vertical axis does not start at zero, the ratio of bar lengths no longer matches the ratio of the numbers they represent, making the query less accurate.
For more on efficient mapping, see Effective use of visual features. For color in particular, see Colors in data visualization.
Summary
When presenting data visually, we should consider at least these two things:
- Identify the cognitive tasks the design needs to support and prioritize them.
- Based on those priorities, map data to visual materials so that important tasks can be performed through efficient, accurate visual queries.