Colors in Data Visualization
- Published
Some notes on using color in data visualization.
Two uses of color
This is somewhat oversimplified, but drawing on S. S. Stevens’s levels of measurement, we can divide uses of color into two broad categories:
- Distinguishing different kinds of things (nominal or categorical scales).
- Representing differences in degree (ordinal, interval, and ratio scales).
Consider subway lines 1, 2, 3, and 4. Although 1, 2, 3, and 4 are numbers, nobody calculates that Line 4 is twice Line 2, or Line 3 three times Line 1. They are numbers, but they mean nothing beyond “these are different.” (They do indicate the order in which the lines opened, but that is irrelevant to passengers, so we can ignore it.)
Numbers used this way, to distinguish categories, are called nominal or categorical data. When representing them with color, it is best to use differences in hue. In particular, people across cultures easily perceive and remember the following colors. (Black and white have no hue, but belong in the same list.)
- Black
- White
- Red
- Green
- Yellow
- Blue
This ordering has been supported by cultural-anthropological research and also has a physiological basis: color-opponent processing beginning in the retina and lateral geniculate nucleus. Be careful, however, because people with red–green color blindness have difficulty distinguishing red and green.
By contrast, numbers involving magnitude or order, such as water temperature, rankings, percentages, and weight, are called ordinal—from order. More precisely, these can be divided into ordinal, interval, and ratio scales; see Level of measurement.
For ordered numbers, differences in lightness or saturation are preferable to differences in hue. A natural mapping gives larger numbers greater contrast with the background. For example, suppose a scale runs from light red toward increasingly dark red. Against a dark background, assigning light red to the largest value feels natural; against a light-red background, assigning dark red to the largest value does.
Look at the grayscale section in the middle of the following image. Does black represent a larger number, or does white? There is no single answer. We can only say that the color with greater contrast against the background represents a larger number.
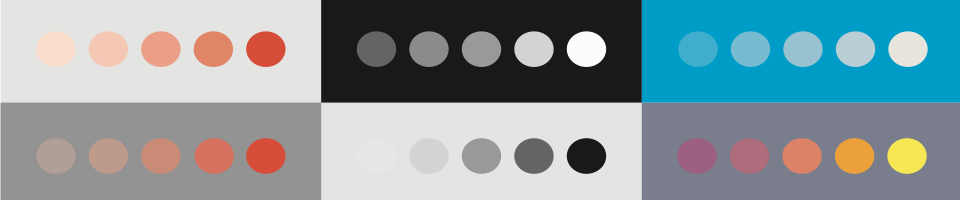
Color spaces and distances between colors
Physically, light is a distribution of intensities across wavelengths. But the eye has only three types of color-sensitive photoreceptor, or cone—long-, medium-, and short-wavelength—so that distribution is compressed into three signals. This is why different spectra look like the same color if they produce the same three signals (metamerism).
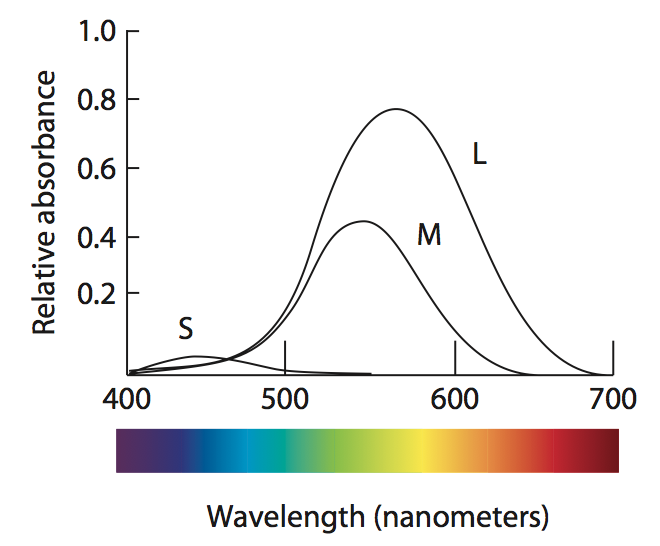
The diagram shows the wavelength ranges to which the three types of cone respond (X-axis) and how much light they absorb (Y-axis). Two interesting points are that the L-type range covers almost the entire M-type range, and that S-type absorption is very small.
What does this have to do with visualization?
A great deal. First, if blue and yellow light enter the eye at the same intensity, blue will feel relatively weak—look at the S-type cone curve. Yellow, on the other hand, stimulates both M- and L-type cones, making them fire vigorously. These three signals are then recombined as shown below. The M- and L-type signals are added to form the white–black channel; the S-type signal is subtracted from that to form the yellow–blue channel.
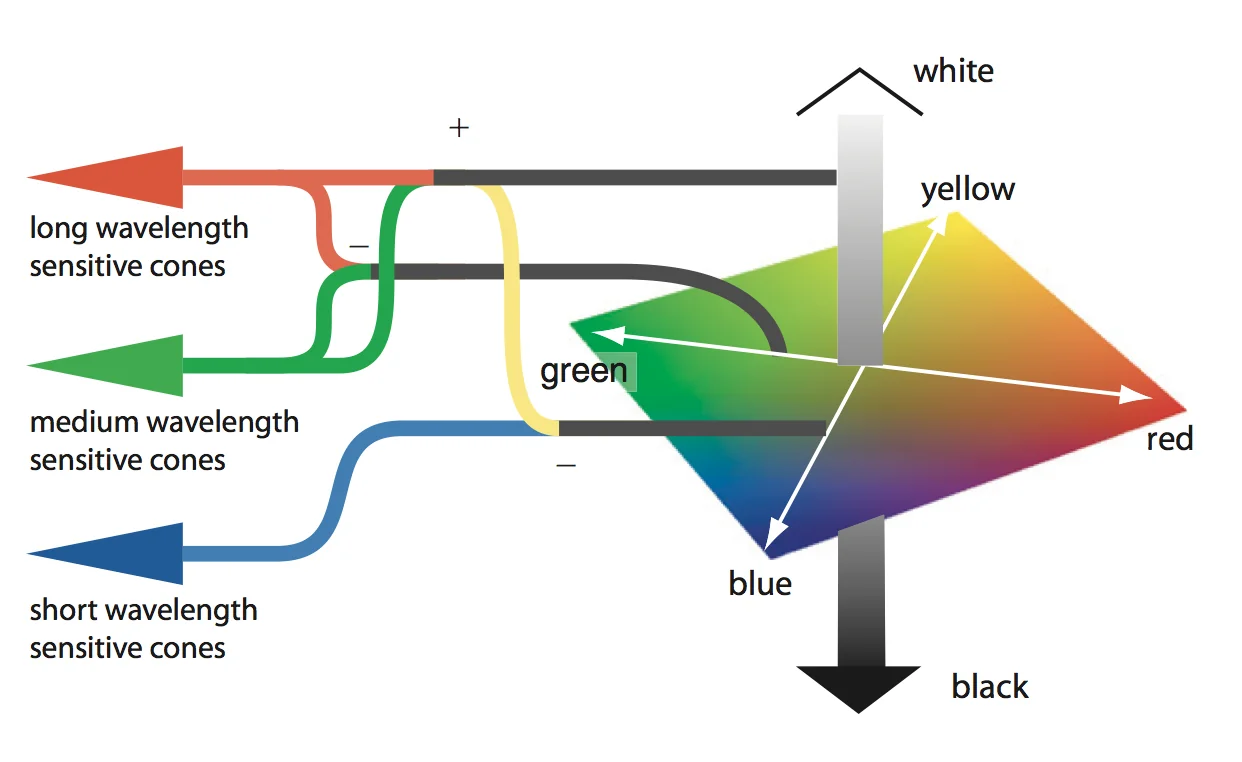
This is why blue text is difficult to see against a black background—black is essentially the absence of light—while yellow text is easy to see.
Because the compression into three signals is so uneven, the coordinate system we use for color must be distorted accordingly.
The familiar HSV color space has no such correction. Even if we sample colors at equal intervals around its hue wheel, those near yellow look particularly bright and those near blue particularly dark. They are evenly spaced numerically, but not perceptually.
CIELAB was designed to reduce this mismatch. It has three axes: L* (lightness), a* (green–red), and b* (blue–yellow). Distances between color coordinates are designed to be roughly proportional to perceived differences. But because it represents the actual range of visible colors, the usable extent differs along each axis. Yellow, for example, can be very bright, while there is no blue of the same brightness.
We can finally discuss perceptually appropriate distances between colors. To choose colors for nominal categories, hold L* constant and sample around the a*b* plane. To represent differences in order or magnitude, sample at equal intervals along L*.
The simple conclusion is that when choosing colors for data visualization, it is best to use CIELAB or a color space derived from it.
Representing depth and fine differences
The color-opponent processing mentioned earlier produces three opponent channels. Two—yellow–blue and green–red—are chromatic channels; the third, black–white, is the luminance channel.
Probably for evolutionary reasons, the luminance channel is optimized for representing surface shape from shading in the visual field, while the chromatic channels are not. Representing the same information through chromatic channels alone and through the luminance channel alone can therefore make an enormous difference.
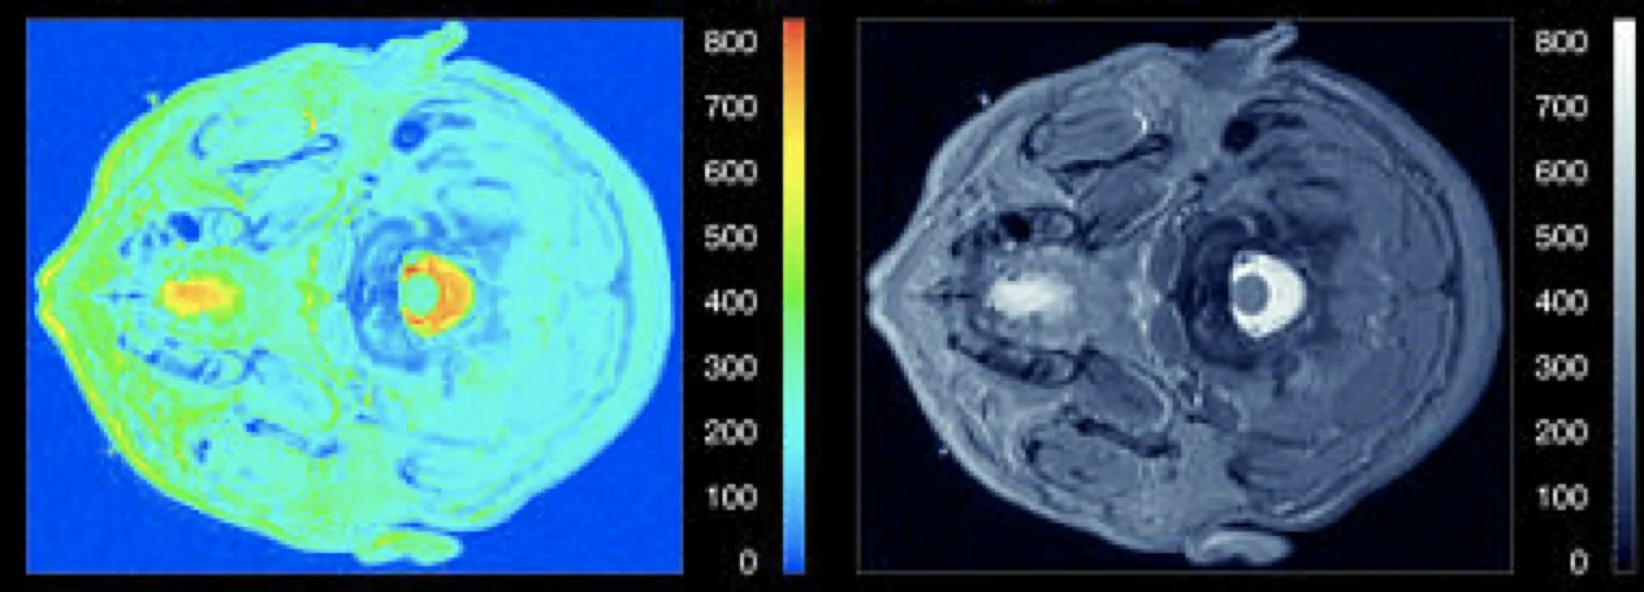
When using color to represent height on a two-dimensional plane, using the luminance channel preserves far more detail than rainbow color coding.
Time and distance
One last point.
How should we graph sales changes over the last three years? The sequence 2010, 2011, 2012 has an order. That makes it at least an ordinal scale, so differences in lightness or saturation would be appropriate. But should 2010 or 2012 receive the stronger color?
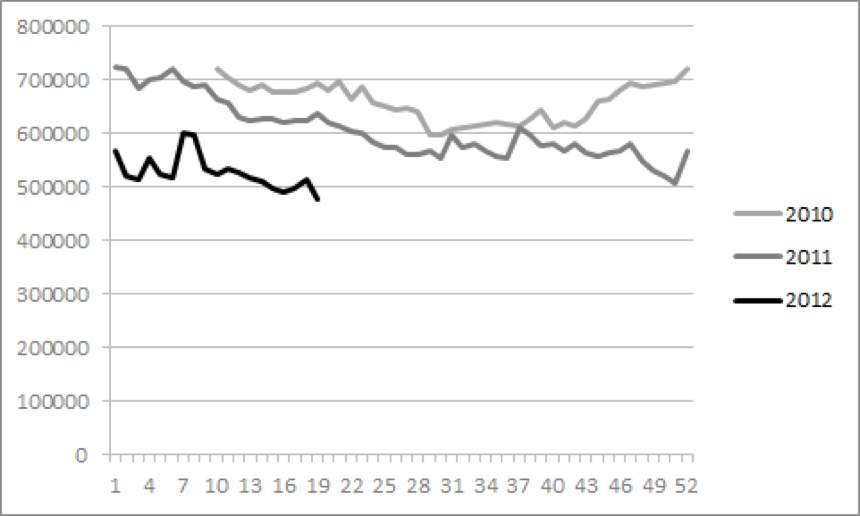
I think research on metaphor and mental schemas by George Lakoff, Mark Turner, and others helps here. Their work suggests that spatial distance and temporal ordering can share a schema. Greater distance means a time farther from the present, whether past or future. Distant objects look faint. Mapping the distant past to fainter colors therefore feels natural.