The real message of her rose diagram
A summary of Hugh Small’s 2010 article “Florence Nightingale’s Hockey Stick: The real message of her rose diagram”1. I read it around 2017 and was deeply impressed.
Overview
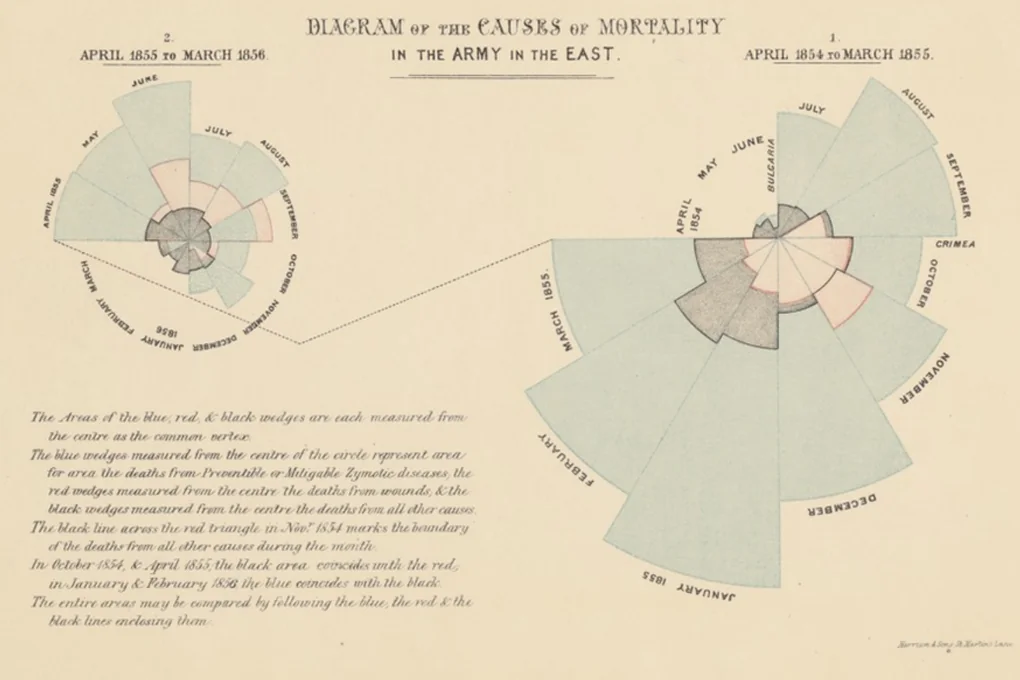
Nightingale’s coxcomb diagram is famous as an early example of data visualization, but if you look closely, there are more than a few odd things about it. If we consider the political context Nightingale was in when this diagram was used, and the goals she was trying to achieve, we can understand the design of this diagram better.
Problems
In fact, the orthodox way to visualize the original data of the coxcomb diagram is a stacked bar chart with time on the X-axis and number of deaths on the Y-axis. According to various data visualization guidelines, the coxcomb diagram has several problems.
- It expresses time-series data as two charts by cutting it at an arbitrary point in time (March 1855).
- Moreover, the 1854 data is on the right, and the 1855 data is on the left. In left-to-right cultures, the standard practice for time-series charts is generally to represent the flow of time from left to right.
- It maps one-dimensional data onto the area of a two-dimensional space (an arc), and in the process applies a square root transformation. In other words, if people compare based on the radius of the arcs, the monthly differences will feel smaller than they really are. (When each datum is represented as a separate circle, it is generally said that mapping to area rather than radius is the better method, but in the case of a stacked bar chart expressed in polar coordinates like the coxcomb diagram, this principle becomes ambiguous.)
Why did she do that?
Deliberate transformations
Nightingale believed that the death rate could be reduced by improving hygiene in field hospitals—ventilation, increasing the spacing between beds, washing hands, and so on—but John Simon, the Chief Medical Officer of the British government at the time, firmly believed that reducing the death rate was “practically impossible.”
Nightingale needed to persuade the military, politicians, and the public, and she wanted to show something persuasive in a picture rather than in writing.
- The period covered by the diagram was exactly 2 years (April 1854 to March 1856), and Nightingale’s “sanitary commission” began intervening from exactly the midpoint. There was a need to compare before and after the intervention. Rather than simply putting a dividing line in the middle of an ordinary bar chart, she wanted to present before and after intervention as separate charts so that one could see at a glance that the magnitude of deaths had clearly decreased. In other words, she wanted viewers not to grasp the monthly trend by looking at bars, but to compare a large circle (= many deaths) with a small circle (= few deaths).
- A bar chart showing two full years at once not only makes comparison between the first and second years difficult, but also makes seasonal comparison difficult. If you use polar coordinates and place two charts side by side, seasonal comparison becomes easier.
- In January 1855, the number of deaths surges, and this could produce the result of overemphasizing “General Winter” (an increase in mortality due to severe winter weather), which interferes with the original goal of comparing before and after intervention. So by using a square root transformation (that is, encoding the data in the area of the arcs rather than their radius), she compressed the monthly differences, and as a result made it possible to focus more on the before-and-after comparison.
- Why is 1854 on the right? Hugh Small guesses that perhaps it was because she wanted to render neatly the dotted line connecting March 1855 to April 1855—that is, without crossing the circle.
Is it okay to distort data?
Authorities in the field of data visualization such as Edward Tufte despise this kind of distortion. They sometimes call the phenomenon whereby bad visualization makes numerical values less visible “dequantification,” propose a “lie factor” to indicate how much distortion there is, and, when the degree of distortion is severe, criticize it as chartjunk. (For details, see Visual Explanations.)
People may differ, and situations may differ, in how they think about what the right action is, but I seem to lean a bit more toward consequentialism (the view that the action that leads to a good outcome is the right action) than deontology (the view that there are proper rules one ought to follow, and that following them is the right action). This may be a dangerous thing to say unless I add a lot of qualifications (if you’re curious about those “many qualifications” concerning consequentialism, see Utilitarianism: A Very Short Introduction), but if I could save countless lives by distorting data slightly (think of the achievements of the sanitary reforms Nightingale actually accomplished), I think I would gladly do the distorting.
The best method would be to convey the desired message without distorting the data (Alberto Cairo), but what I mean is that if, because of some constraint, I absolutely had to choose, then I would choose that way.
Still, it would be a problem if this conclusion were read as “if the end is good, distortion is permissible.” As I looked at in The history of deceptive patterns, B. J. Fogg also proposed captology under the banner of good intentions, and that good intention prevented absolutely nothing that happened afterward. The end cannot be the criterion.
What can serve as a criterion is direction. Is this an encoding that helps the reader better perceive relationships already present in the data, or is it an encoding that pushes the reader toward a conclusion not present in the data? The coxcomb does both at once, which is why judgments differ. The choice to divide before and after the intervention into two charts is closer to the former. The fact that the main cause of death was not battle but hospital hygiene was already evident in the data, and an ordinary bar chart would instead have made both that contrast and seasonal comparison harder. By contrast, the choice to suppress monthly variation through a square root transformation in order to restrain the “General Winter” interpretation is closer to the latter. It made the reader less able to see variation that really is in the data.
So the honest thing would be to narrow the conclusion of this post from “distortion is okay” to something like “some of the coxcomb’s choices are easy to justify, and some are not.”